Most Americans are familiar with artificial intelligence and automation within science fiction. Technological advances may result in the fulfillment of things that once seemed impossible, such as Amazon using drones to deliver purchases to your house within 30 minutes (USA Today), or self-driving cars allowing you to take a nap on your drive from Richmond to Orlando.
These advances in semi-automation and automation technologies are poised to drastically change military operations. Unmanned Aerial Systems (UAS) and Unmanned Ground Systems (UGS) are an increasingly attractive option for the US military, especially in an era of reduced manpower and fiscal constraints. Automation has the potential to reduce accidents, function in more difficult conditions than a human driver can endure, and reduce fuel consumption and maintenance requirements. Automated vehicles can mitigate or eliminate crew or driver rest requirements, allowing for continuous operations or reducing the vehicle fleet required to move a given amount of cargo. In addition to those benefits, tasks that can be completed by a “robot” can remove Soldiers from danger, reducing the risk of injury or death. While some tasks will not translate between the commercial and defense sectors, much of the technological innovation can be transposed. This reduces the costs to the Department of Defense for research and development, and allows for future commercial development to be incorporated into defense platforms.
However, discussions involving automation often result in debates about specific terms, and ways to best define a system’s “smartness.” Various solutions have been proposed, and agencies each have their own definitions. This can make communication within acquisitions and between industry participants difficult. The Department of Defense acquisition system is designed to acquire systems with required capabilities, or software to fill a particular need. Semi-automation and automation are a unique and different problem set, because they are in effect a hardware and software solution to a problem. Requirements must not only address a system’s physical capabilities, but also the actions of the system under certain conditions.
The scope of this model focuses on conducting military convoy operations under a variety of conditions, but only consisting of three vehicles for a sixty minute mission. This model does not address combinations of automation categories, such as “Leader-Follower” combined with “Driver Assist,” “teaming” situations where individual automated vehicles become “smarter” when networked with other vehicles, nor learning curves where a system may require less input over time as the system “learns.” The purpose of this initiative is to establish a quantitative mathematical model to visually depict: human input frequency versus system configurations, robotic decision making ability versus system configuration, and the relationship between human input frequency and robotic decision making ability.
This framework models and discusses “Human Input Frequency” (H) and “Robotic Decision Making Ability” (R). Human input frequency is defined as instructions received, as a fraction of the total operating time. This can be never be zero, as any system requires a human being to turn it on for the first time, no matter how “smart” it is, and provide the information critical to accomplishing the mission. Input is the transmission of instructions, while interaction is simply the transmission of data such as location or video feeds. A system can simultaneously receive input, interact with the operator, and execute its assigned task. “R” is defined as the ability of the system to perform a given set of tasks. This list can change based on the system, but the list was primarily focused on its potential application in vehicles.
- Human Input Frequency: the frequency with which an operator must provide instructions to the robot. This is a ratio of the total time of input divided by the total time of task/mission accomplishment. This will produce a value between 0 and 1. This value cannot be zero. This is not the same as frequency of feedback. (Human Input Frequency is not equal to Interaction Frequency, which may be initiated by either the human or the system.) A system may receive instructions and operate at the same time.
- Interaction Frequency: the frequency of communication of any type between the operator and the system. Can be initiated by either the operator or the system.
- Complexity of Instructions/Tasks: a function of the skill and experience level (human and/or automated) required to accomplish a task under current conditions. This is not dependent on the machine’s intelligence. Do not assume that a system is “dumb” because it requires complex instructions.
- Robotic Decision Making Ability: the number of variables that the system can perceive and is allowed AND able to control. This was scored based on fifteen factors, including everything from acceleration, reacting to road signs, and terrain the system could traverse.
Automation can be partitioned into sub-categories. This project focused on the logistical platforms, which conduct military convoy operations, consisting of three or more tactical wheeled vehicles moving supplies and/or personnel from one location to another as a group with a company commander. Calculations were based on a convoy of three tactical wheeled vehicles executing a sixty minute mission. Below are the various levels of automation identified for conducting convoy operations.
- Status Quo: vehicles are operated entirely by human operators. The scenario would have three vehicles and three operators with continuous input/control. The system does not make decisions (R=0).
- Remote Control: a system which allows an operator to drive a vehicle or platform from a location other than inside the vehicle. This system configuration can be wired or wireless, but the operator does not require sensory data from the system. The scenario would have three vehicles and three operators (assuming a 1:1 ratio) with continuous input (H) and control (R). The system does not make decisions (R=0).
- Tele-operation: a system which allows an operator to drive a vehicle or platform from a location other than inside the vehicle. This system configuration can be wired or wireless, but the operator does require sensory data from the system. The scenario would have three vehicles and three operators (assuming a 1:1 ratio) with continuous input (H) and control (R). The system does not make decisions but does interact (R=0).
- Driver Warning: a system within the vehicle which provides visual, auditory or other forms of notification to platform drivers of potential dangers, obstacles, and accidents. The scenario would have three vehicles and three operators with continuous input (H) and control (R). The system does not make decisions but does interact (R=0).
- Driver Assist: a system within the vehicle which provides assistance to drivers by assuming temporary control of one or more vehicle functions such as braking. The scenario would have three vehicles and three operators with near continuous input (H) and control (R). The system does make decisions under certain conditions. (R ≠ 0).
- Leader-Follower: a system involving two or more vehicles which allows a “follower” vehicle to mimic the behavior of the “leader” vehicle in the order of movement.
- Tethered (LF1): vehicles within the convoy are physically connected. The lead vehicle has an operator but follower vehicles do not. The system does make decisions under certain conditions (R ≠ 0).
- Un-Tethered (LF2): vehicles within the convoy are connected via non-physical means (radio, etc.). The lead vehicle has an operator but follower vehicles do not. The system does make decisions under certain conditions (R ≠ 0).
- Un-tethered/Unmanned/Pre-driven (LF3): vehicles within the convoy are connected via non-physical means. No operators are present in any of the vehicles. The system does make decisions (R ≠ 0).
- Un-tethered/Unmanned/Uploaded: vehicles within the convoy are not tethered, and map data is uploaded from a database. No operators are present in any of the vehicles. The lead vehicle operates in a way-point mode while the remaining vehicles are “followers” and mimic the behavior of the preceding vehicle. The system does make decisions (R ≠ 0).
- Way Point Mode: a mode of operation where the system follows a path generated by a series of waypoints. The differentiation between leader-follower and waypoint is that in waypoint each vehicle is independent and can move within formation, while the “follower” vehicles in leader-follower are dependent and cannot function if the lead vehicle is disabled.
- Pre-recorded “Breadcrumb” (WA1): the system must be initially “taught” by a pre-recorded route driven by an operator. No operators are present in the vehicles after the initial teaching. The system does make decisions under certain conditions (R ≠ 0).
- Uploaded “Breadcrumbs” (WA2): digital map data is provided to the system and waypoints plotted by an operator. No operators are present in the vehicles during mission execution. The system does make decisions under certain conditions (R ≠ 0).
- Full Automation:
- Uploaded “Breadcrumbs” with Route Suggestion (FA1): digital map data is provided to the system, with specified origin and destination. The system will provide suggested routes. No operators are present in the vehicles during mission execution. The system does make decisions under certain conditions (R ≠ 0).
- Self Determining (FA2): the system determines its own route given that the grid coordinates of the origin and destination are provided, performs all safety-critical driving functions, monitor roadway conditions, and interpret sensory information to identify obstacles, relevant signage, and dynamically re-route to traverse alternate routes through uncharted, all weather environments for the entire mission. No operators are present in the vehicles during the mission. The system makes almost all the decisions (R ≠ 0).
The most current modeling of an automation scale uses an exponential curve to depict the increasing intelligence of systems. Although this scale is generally accepted across the robotics community, there has never been any mathematical modeling to support an exponential curve for a vehicle’s “smartness.” Thus, the only valid information to support the above claim is a logical understanding of the positive correlation which exists between a vehicle’s “smartness” and the system configuration modes.
The framework described in this article is “a” way to consider the various implementations of semi-automation and automation and should allow both acquisitions personnel and sustainers to discuss both the minimal requirements and the maximum boundaries of automation that is “safe.”
Analysis began by calculating the percentage of human input frequency required for each respective system configuration of automation with respect to the given scenario, which states that three tactical wheeled vehicles are conducting a sixty minute mission.
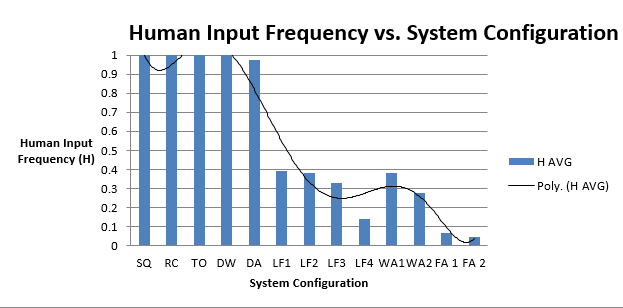
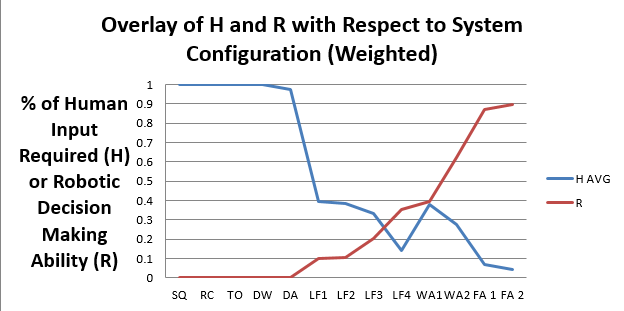
The results of the analysis are highlighted in the “Human Input Frequency vs. System Configuration” chart. A mathematical equation could be calculated using regression analysis, which will accurately model the relationship between H and the system configurations. Beyond the pure mathematics of the model, it is possible to identify “breaks” where the system configurations require a significant change in H, i.e. SQ, DW, DA, RC, and TO form the first “group” with a human input (H) requirement of approximately 100%, LF1, LF2, LF3, and LF4 form the second “group” with a significantly lower H range when compared to the first “group,” and WA1, WA2, FA1, and FA2 form the final group which asymptotically converges to an approximate H value of 0%.
With a clear understanding of the relationship between human input frequency and system configuration, the next step was to mathematically model a system configuration and its respective decision making ability. In order to differentiate each level of automation, decision making probabilities were calculated for each system configuration based on their respective ability to execute tasks, e.g. acceleration, deceleration, interval/formation integrity, etc., independent of human input. The results from the analysis are displayed in the “Robotic (“Smartness”) vs. System Configuration” chart.
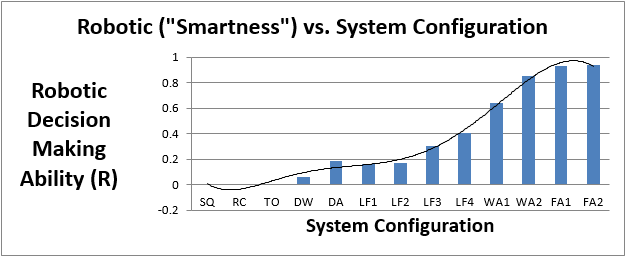
Based on the results, it is clear that R cannot be modeled accurately using an exponential curve. The curvature and number of inflection points indicates that an exponential distribution would not accurately model the system. Regression analysis determined that a polynomial equation accurately models the distribution. The one deficiency of these results is that it does not incorporate H into the model. It is necessary to integrate the human input frequency into the model because it is not sufficient to model the probability of a particular system configuration’s ability to execute the established tasks on a first attempt without understanding the amount of time which the system could potentially experience each task.
Hence, the results from the “Human Input Frequency vs. System Configuration” chart were used as a weighting coefficient and multiplicatively combined with the results from the “Robotic (“Smartness”) vs. System Configuration” chart to produce the final mathematic model in the “Robotic (“Smartness”) vs. System Configuration Weighted by H” chart.
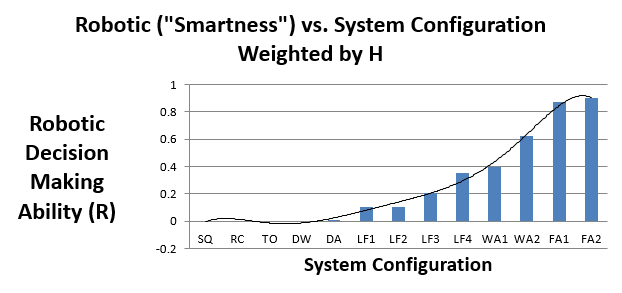
This model now incorporates the probability of each system configuration being able to execute the identified tasks independently of additional human input. Thus, the system must now have the authority to execute a given task, and the ability. Regression analysis was used to create a mathematical equation that is extremely accurate for modeling R and the system configuration when weighted by H. Below is an “Overlay of H and R with Respect to System Configuration (Weighted)” chart, which can be used to summarize the above results.
Therefore, the results of the analyses conclude that the null hypothesis of an exponential function to model R should be rejected in favor of the alternate hypothesis, which states that R cannot be modeled using an exponential function. In particular, a polynomial function creates the “best fit” by minimizing the sum of the squared residuals between the actual and projected values of R Weighted by H for each system configuration.
After successfully modeling H and R against the various system configurations, the final analysis to pursue was to create a mathematical model which accurately models R in terms of H. The model displayed below in the “Mathematically Modeling H and R” chart can be used to estimate a military convoy operation “Smartness” based on the amount of human input required.
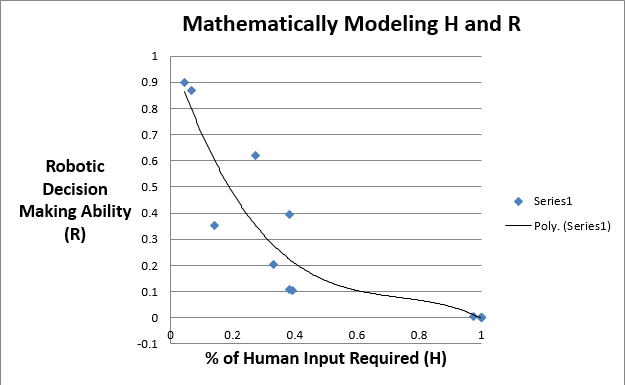
Regression analysis was used to create the “curve of best fit,” which was a sixth order polynomial distribution. However, a third order polynomial distribution is shown above because it is more visually logical than the sixth order polynomial equation. Even though the sixth order polynomial distribution minimized the sum of the squared residuals, the distribution included a significant portion of negative values, which are not possible. Therefore, the third order polynomial distribution makes more logical sense, even though it does not “fit” the data as well as other alternatives. The above model now provides organizations throughout the robotics community a way to quantify H and R, and determine where a specific scenario may fall on the scale of automation.
The potential implications are staggering for national security and defense. Automation could allow for equal or greater combat power with drastically reduced personnel requirements, greater efficiencies in fuel consumption and maintenance, and increased utilization of platforms and assets. This model can serve as the basis for further discussion and analysis as the Department of Defense wrestles with the incorporation of automation into military operations. Increased use of automation will create a variety of challenges ranging from the technological and operational to the legal and moral. Further research can be conducted to better quantify the impacts on manning and training, maintenance, fuel efficiency, and deployability.